
Dashboard Design Best Practices
This blog post introduces an interactive presentation on Best Practices for Dashboard Design in Tableau.
Keep reading
3 Ways to Build Gradients in Tableau
This blog post provides an in-depth walk through on how to create stunning gradients in Tableau. It includes three different methods that vary in complexity and appearance.
Keep reading
It’s not the Field of Dreams: Making the Most of Enterprise Analytics
If we build (or buy) the best data platform we can afford, the users will be clamoring to use it, right? …and when they don’t, we’ll blame the software, switch platforms, and repeat the cycle. Or we’ll just grumble and stick with Excel. When this happens, there’s understandable frustration from leadership and staff, disengagement, lost…
Keep reading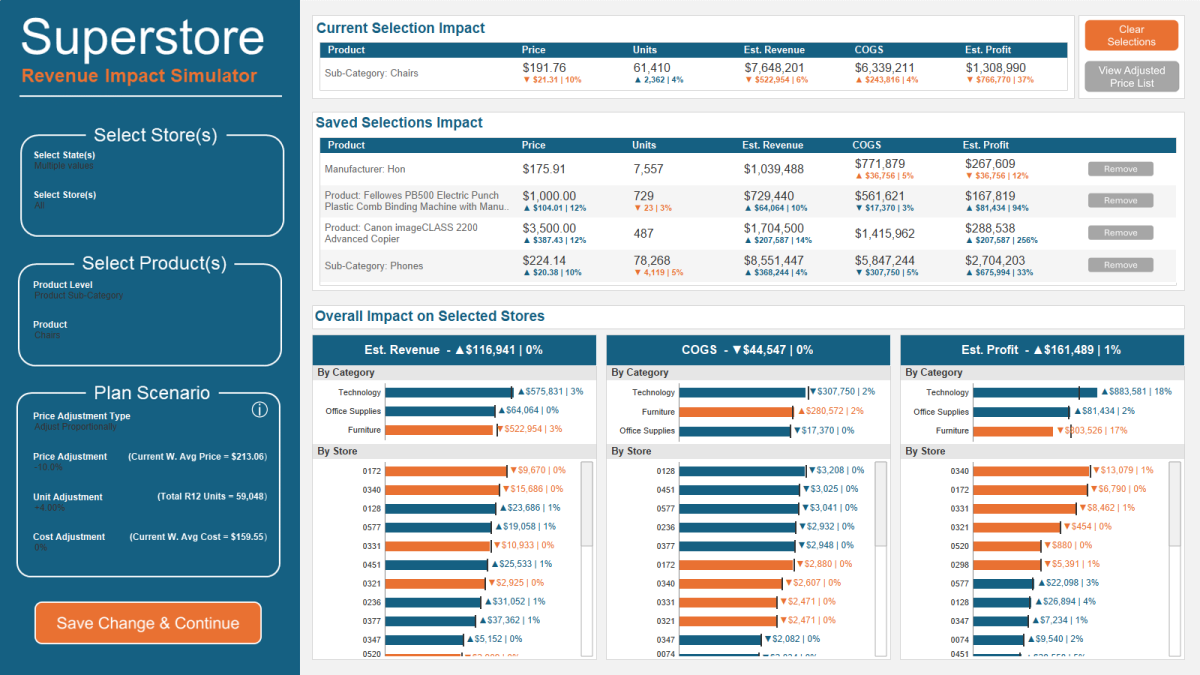
Advanced What-If Analysis in Tableau
This post walks through how to create a powerful simulation tool in Tableau
Keep readingSomething went wrong. Please refresh the page and/or try again.
Get new content delivered directly to your inbox.
