

This post is an add-on to Part 2 of the Fun with Curves in Tableau series.
Recently, after using the post above to create a chord chart, someone had reached out asking if there was a way to tone down the curves, or, as they had put it, to make them less “bouncy”. I started racking my brain trying to figure out how to make that happen. In my mind, the only possible way to change the intensity of the curves would be to calculate a new mid-point for each of the lines, rather than using the center of the circle (0,0).
For the next hour or so, I wrote and tested 9 new calculated fields that would allow users to “smooth” their curves. Excitedly, I jumped back on Twitter to share my update, and found that this person had not only figured out how to do it, but the method they came up with was exponentially easier than what I had done. So a huge thank you to Anne-Sophie Pereira De Sá for figuring out Method 1 below for controlling your curves.
Luckily, the work I had done wasn’t a complete waste, as it led me to two more methods for controlling the intensity of the curves. So in this post we’re going to cover a total of three different approaches depending on what you want your curves to look like.
Also, just want to mention that these methods are really only relevant if you’re building a radial chart, like a chord chart. If you are using the Part 2 tutorial to build something like an Arc Chart, there are much easier methods for controlling the intensity of the curves (you can modify the intensity of the curves by adjusting the Y_Mid value).
If you want to follow along, I have updated the sample workbook for Part 2 of the series, which can be downloaded here.
The Methods
Method 1: Smoothing
The first method will allow you to tone down the intensity of your curves and it is incredibly easy to implement. It uses a parameter to set the intensity of your curve using values from 0 (standard curve) to 1 (no curve). The height of each curve is changed proportionally (ex. .1 will reduce the height of each arc by roughly 10% from it’s standard curve height).
Method 2: Consistent Scaling
This method allows you to create consistent curves (same arch height) for all of your lines, regardless of where the start and end points are on the circle. It’s much more complicated, but the result is pretty nice. Again, this method uses a parameter with values between 0 and 1 to set the intensity of the curve.

Method 3: Dependent Scaling
The final method allows you to set the arch height based on the length of the line, so shorter lines on the outside of the circle will have a lower arch, and longer lines going through the middle of the circle will have a higher arch. The approach is similar to Method 2, sharing many of the same calculations, and also uses a parameter with values between 0 and 1 to set the intensity of the curves.

Method 1 walk-thru
As I mentioned above, this method is incredibly easy to implement (thank you again Anne). All you need is a new parameter and a few small tweaks to the Bezier X and Y calculations. First, let’s create our parameter.
- Create a new Parameter called “Smooth Factor”
- Set Data type to “Float”
- Set Current Value to 0
- Set Allowable values to “Range”
- Set Minimum to 0
- Set Maximum to 1
- Set Step size to .1

Next, let’s modify our calculations. The only difference between the calculations discussed in the original post, and the calculations used here, are the exponents. The original calculation has an exponent of 2 in two sections of the calculation. Anne had figured out that if you replaced this exponent with a 1, you got a straight line, and if you replaced it with anything between a 1 and a 2, it would tone down the curve of the line proportionally.
Here is our original calculation for X
((1-[T])^2*[Circle_X_Start] + 2*(1-[T])*[T]*0+[T]^2*[Circle_X_End])
And here is our new calculation for X
((1-[T])^(2-[Smooth Factor])*[Circle_X_Start] + 2*(1-[T])*[T]*0+[T]^(2-[Smooth Factor])*[Circle_X_End])
The only difference between the two calculations is that we replaced ^2 with ^(2-[Smooth Factor]) in both places. That’s it. So here are our new calculated fields for X and Y and we’ll keep the naming consistent with the original post
Circle_Bezier_X_Smooth = ((1-[T])^(2-[Smooth Factor])*[Circle_X_Start] + 2*(1-[T])*[T]*0+[T]^(2-[Smooth Factor])*[Circle_X_End])
Circle_Bezier_Y_Smooth = ((1-[T])^(2-[Smooth Factor])*[Circle_Y_Start] + 2*(1-[T])*[T]*0+[T]^(2-[Smooth Factor])*[Circle_Y_End])
Now, assuming you had already created your chord chart using the original post, just replace [Circle_Bezier_X] with [Circle_Bezier_X_Smooth] and replace [Circle_Bezier_Y] with [Circle_Bezier_Y_Smooth] and you’re done. Just play around with the parameter to get the intensity of curve that you’re looking for.
Method 2 walk-thru
As I mentioned earlier, this method is a lot more complicated. It involves calculating a new mid-point for each of our lines using some geometry and trigonometry. But similar to the first method, we’ll need a parameter to set the intensity of our curves, so let’s start there.
- Create a new parameter called “Consistent Factor”
- Set Data type to “Float”
- Set Current Value to .5
- Set Allowable values to “Range”
- Set Minimum to 0
- Set Maximum to 1
- Set Step size to .1

Now here comes the tricky part. And I am sure there is a much easier solution out there, but this is what I was able to come up with.
As we discussed in the original post, to draw these curved lines, we’re essentially creating a bunch of triangles and letting the Bezier X and Y calcs do the rest of the work.

Each of these triangles have a different height depending on where, around the circle, the starting point and the ending points appear. We’re using 0,0 as the mid point, so all of the triangles meet in the middle. But if we want to apply a consistent curve to all of our lines, then we need to calculate a new mid point for each of our triangles. And the result of that new mid-point calculation, should be a bunch of triangles with the same height.
You may remember from earlier posts, that in order to plot points around a circle, we need two inputs; the distance from the center of the circle, and the position around the circle. The position around the circle is much easier to calculate so let’s start there. Let’s create a calculated field called “Scale_Mid_Point_Position”
Mid_Point_Position = IF([Position_End]-[Position_Start])*360 >180 THEN (([Position_End]-[Position_Start])/2)+[Position_Start]+.5 ELSE (([Position_End]-[Position_Start])/2)+[Position_Start] END
Now this calculation looks a little complicated, but basically what it’s doing is calculating the center of the vertex angle for each of our triangles by comparing the start and end position of each of our lines. Because this is a circle, this comparison might result in an angle that is greater than 180 degrees, which isn’t possible for a triangle. Really, it just means that our starting point and ending point are farther apart (more than .5) so the direction of the triangle flips. So when that happens, we want the inverse of that position, which we can get by adding “.5” to the calculation. Otherwise, we are just subtracting the start position from the end position, splitting the difference, and then adding it back to the start position to get the position that is directly in the middle of the start and end.
Ok, if I haven’t lost you yet, let’s keep moving. Now we need to calculate the distance from the center for each of our new mid-points. To get there, first we need to calculate the height of our existing triangles (that meet in the middle at 0,0). Unfortunately, it’s not that easy. There are a lot of different ways to calculate different parts of a triangle, so we have to work with what we got. We know the length of two sides of the triangle (equal to the radius of the circle), and we know the vertex angle. That alone isn’t enough to calculate the height (as far as I know), but it gets us a step closer. With that information, we can calculate the length of the base.
First, a quick look at the parts of one of our triangles.

Now let’s calculate the Vertex angle, which is going to be very similar to the position calculation we just did.
Vertex_Angle = IF ([Position_End]-[Position_Start])*360 >180 then 360-(([Position_End]-[Position_Start])*360) else ([Position_End]-[Position_Start])*360 END
Now, with that, along with our circle’s radius, we can calculate the length of the base.
Tri_Base = SQRT([Radius]^2 + [Radius]^2 – 2*[Radius]*[Radius]*COS(RADIANS([Vertex_Angle])))
And now that we know the length of all three sides of the triangle, we can calculate the height.
Tri_Height = SQRT([Radius]^2 – ([Tri_Base]^2/4))
Now we have everything we need to calculate the distance from the center for each of our mid-points. We want all of our triangles to be the same height. So first, we need a consistent height to use. We can get there by multiplying our radius by our newly created Scale Factor. Our radius = 20, so if our scale factor equals 0, the height will be 0. So no curve. If our scale factor is .5, our height will be 10. Easy.
Now, if we take the height of our existing triangle, and then subtract our new standardized height, that will give us the distance from center, our second and final input.
Con_Mid_Point_Distance = [Scale_Tri_Height] – ([Radius]*[Consistent Factor])

You can see in the gif above that all triangles now have the same height.
Now we have the position and distance from center for our mid points. All that we have to do is calculate the coordinates for the mid-points using those inputs, and then plug those coordinates into our Bezier X and Y formulas.
Con_Circle_X_Mid = [Con_Mid_Point_Distance]* SIN(2*PI() * [Scale_Mid_Point_Position])
Con_Circle_Y_Mid = [Con_Mid_Point_Distance]* COS(2*PI() * [Scale_Mid_Point_Position])
Circle_Bezier_X_Con = ((1-[T])^2*[Circle_X_Start] + 2*(1-[T])*[T]*[Con_Circle_X_Mid]+[T]^2*[Circle_X_End])
Circle_Bezier_Y_Con = ((1-[T])^2*[Circle_Y_Start] + 2*(1-[T])*[T]*[Con_Circle_Y_Mid]+[T]^2*[Circle_X_End])
Now, again assuming you had already built your chord chart using the original post, just replace [Circle_Bezier_X] with [Circle_Bezier_X_Con] and replace [Circle_Bezier_Y] with [Circle_Bezier_Y_Con] and play with the parameter to get the curve intensity you want.
Method 3 walk-thru
This method is going to be extremely similar to Method 2. The only thing we are changing is the value that we subtract from our triangle height to get the distance from the center for our new mid-points. If you went through Method 2 above, you are already 90% there. Like the other two methods, we need a parameter to control the intensity of our curves. Let’s create one called “Dependent” Factor”
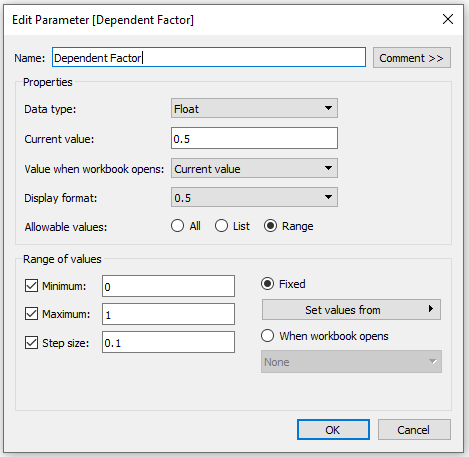
- Create a new parameter called “Dependent Factor”
- Set Data type to “Float”
- Set Current Value to .5
- Set Allowable values to “Range”
- Set Minimum to 0
- Set Maximum to 1
- Set Step size to .1
Now we need most of the same calculations that we used in Method 2. I’ll list them here again in case you haven’t already tried that method, but for explanations of these calcs, please read through method 2 in the previous section.
Mid_Point_Position = IF([Position_End]-[Position_Start])*360 >180 THEN (([Position_End]-[Position_Start])/2)+[Position_Start]+.5 ELSE (([Position_End]-[Position_Start])/2)+[Position_Start] END
Vertex_Angle = IF ([Position_End]-[Position_Start])*360 >180 then 360-(([Position_End]-[Position_Start])*360) else ([Position_End]-[Position_Start])*360 END
Tri_Base = SQRT([Radius]^2 + [Radius]^2 – 2*[Radius]*[Radius]*COS(RADIANS([Vertex_Angle])))
Tri_Height = SQRT([Radius]^2 – ([Tri_Base]^2/4))
Here is the main difference between this method and the previous one. Instead of multiplying our factor (parameter) by a consistent value, like radius, we are going to multiply it by the base length of our triangles. This will result in a higher value for longer lines, and a lower value for shorter lines. Just want to point out that I divided the base length by 2 in these calculations, to tone down the curves a little more, but that is optional. Here is the calculation for the distance from center for each of our new mid-points.
Dep_Mid_Point_Distance = [Scale_Tri_Height] – (([Scale_Tri_Base]/2)*[Scale Factor])

You can see in the gif above that the height of the triangles are now dependent on the length of their base.
Now we just need to calculate those new mid-points and plug them into our bezier X and Y calculations.
Dep_Circle_X_Mid = [Dep_Mid_Point_Distance]* SIN(2*PI() * [Scale_Mid_Point_Position])
Dep_Circle_Y_Mid = [Dep_Mid_Point_Distance]* COS(2*PI() * [Scale_Mid_Point_Position])
Circle_Bezier_X_Dep = ((1-[T])^2*[Circle_X_Start] + 2*(1-[T])*[T]*[Dep_Circle_X_Mid]+[T]^2*[Circle_X_End])
Circle_Bezier_Y_Dep = ((1-[T])^2*[Circle_Y_Start] + 2*(1-[T])*[T]*[Dep_Circle_Y_Mid]+[T]^2*[Circle_X_End])
Again, assuming you had already built your chord chart using the original post, or one of the previous methods, you just need to replace [Circle_Bezier_X] with [Circle_Bezier_X_Dep] and replace [Circle_Bezier_Y] with [Circle_Bezier_Y_Dep] and play with the parameter to get the curve intensity you are looking for.
That’s it. Three methods for controlling the intensity of your bezier curves. These certainly aren’t necessary when building out your chord charts, but they do produce some nice effects if you are looking to really customize your visualization. Personally, I lean towards Method 1 because of it’s simplicity. If you are looking for something more complicated, Method 2 and Method 3 are both nice, but if I had to pick, I would go with #3.
As always, thank you so much for reading and keep an eye on our blog for more fun Tableau tutorials.

One reply on “Fun With Curves in Tableau Part 2+: Controlling Bezier Curves”
[…] Fun With Curves in Tableau Part 2+: Controlling Bezier Curves […]
LikeLike